Dec 29, 2025

4 min read


When you're debugging a React Native app, you're essentially playing detective with a mix of tools like Flipper, React DevTools, and your code editor. The real trick is figuring out where the bug lives: is it in your JavaScript logic, or is something going wrong deeper in the native code? Getting this right is the secret to building apps that are both stable and fast.

Before you can get into the fancy tools, you need a solid foundation. Debugging React Native effectively isn't just about memorizing commands; it's about getting a feel for the framework's unique architecture. Your app is a constant conversation between JavaScript, running in an engine like Hermes, and native code (Swift/Objective-C for iOS and Kotlin/Java for Android).
Most of the time, you'll be hunting down bugs in your JavaScript—think wonky state management, flawed logic, or UI components that just don't look right. But every now and then, you'll hit a wall with mysterious crashes or performance lags that actually stem from the native side of things, or the communication layer in between.
The core challenge of a
react native debugsession is identifying which side of the "bridge" the problem lives on. Is it a JavaScript error, or is a native module failing silently? Answering this question early saves hours of frustration.
How you debug can change quite a bit depending on your project setup. Knowing what you're working with is half the battle, as each environment brings its own set of tools and limitations. If you're just starting out, getting this part right is crucial, and our detailed React Native setup guide can help you build that solid base.
Here's a quick rundown of the usual suspects:
No matter which environment you're in, the in-app Developer Menu is your ground zero for all things debugging. You can pop it open by shaking your physical device or by using a simple keyboard shortcut in an emulator or simulator.
Cmd + DCmd + M (or Ctrl + M on Windows/Linux)Think of this menu as your command center. From here, you can reload the app, toggle performance monitors, and—most importantly—connect to all the debugging tools we're about to cover. Getting comfortable with this menu is the first real step to becoming a debugging pro. As you'll see, crucial actions like firing up the Hermes debugger or connecting to a remote JS debugger all start right here. It's the gateway to every workflow in this guide.
It's time to graduate from console.log.
Sure, it’s a trusty old friend for a quick check, but a professional React Native debugging workflow demands more powerful, purpose-built tools. Once you get the hang of these, you'll find and squash bugs faster than ever before.
For a long time, the classic starting point was remote JS debugging. You'd flip it on from the Developer Menu, and just like that, your app's JavaScript thread would be connected to your browser's DevTools. This was great for inspecting network requests, analyzing performance, and getting way more context in the console than a simple log could ever provide.
But times have changed. As of React Native 0.73, Remote JS Debugging is officially deprecated and on its way out. While it was a foundational tool for years, it always had a critical flaw: it relied on a separate JavaScript engine, which often created subtle, frustrating inconsistencies between your debug build and what users actually saw in production.
When you're wrestling with a UI bug—maybe a component isn't re-rendering when it should, or it's showing the wrong data—React DevTools is your absolute best friend. It’s a standalone app that hooks directly into your running application, giving you a live, interactive map of your entire component tree.
With DevTools, you can finally see what's really going on:
Connecting React DevTools is dead simple. Just run the standalone app, and it should automatically find and connect to your running React Native app. It’s the single most important tool for understanding the why behind your UI's behavior.
To help you decide which tool to reach for, here's a quick rundown of the heavy hitters in your debugging arsenal.
| Tool | Primary Use Case | Best For |
|---|---|---|
| React DevTools | Inspecting the React component tree | Debugging UI, state, props, and re-renders |
| Flipper | All-in-one native & JS debugging platform | Network requests, native UI layout, device logs |
| VS Code Debugger | Setting breakpoints in your JavaScript code | Step-by-step code execution and variable inspection |
| Xcode / Android Studio | Debugging native iOS/Android modules | Catching native crashes and debugging custom modules |
Each tool has its specialty. You wouldn't use a hammer to turn a screw, and the same logic applies here. Getting comfortable with all of them is the key to becoming a truly effective debugger.
While React DevTools is the master of the component world, Flipper gives you a complete, holistic view of your entire application. It’s the bridge between your JavaScript logic and the native code running underneath.
Developed by Meta, Flipper is an extensible desktop platform that has quickly become the industry standard for modern React Native development.
Getting started involves installing the desktop app and adding a bit of boilerplate to your native iOS and Android projects. If you’re building with Expo, a lot of this is handled for you, which we dive into in our comprehensive Expo React Native tutorial.
Here's a look at the Flipper dashboard, which is your command center for all things debugging.
From this one window, you can select your connected device and access a whole suite of powerful plugins like the Layout Inspector, Network Logger, and more.
Once you’re connected, you can start diagnosing issues that used to feel like a black box. Picture this: a button on your screen is mysteriously hidden behind another view. Instead of just guessing at style properties and reloading, you can fire up the Layout Inspector plugin. It gives you an interactive, 3D view of the native UI hierarchy, letting you click on any element to see its exact dimensions, positioning, and styles. No more guesswork.
Or what if an API call is failing silently? The Network Inspector is your go-to. It logs every single outgoing request, letting you inspect headers, request bodies, and the full server response. A malformed API request or an unexpected server error becomes obvious in seconds.
For a deeper dive into other debugging methods and tools, this article on Prompt Debugging and Tools offers some great insights. These core Flipper plugins are just the start, but they give you a rock-solid foundation for tackling the vast majority of bugs you'll encounter.
Sooner or later, you'll hit a bug that Flipper and React DevTools just can't see. When the trail goes cold on the JavaScript side, it’s a good sign the problem lies deeper—either in the native code or within the Hermes engine itself. This is where you have to roll up your sleeves and go beyond the JS thread.
We're talking about the tricky stuff: silent crashes, performance issues that aren't just slow re-renders, or a custom native module that’s quietly failing. The game plan here is to shift your focus from the React component tree to the underlying native platforms and the JS engine that powers it all.
One of the most powerful moves in your debugging arsenal is setting breakpoints directly in your JavaScript code using Visual Studio Code. Forget littering your code with console.log. A breakpoint lets you freeze your app's execution on a specific line, inspect the live values of every variable, and step through your logic one line at a time. It’s a complete game-changer.
To get this running, you’ll need the "React Native Tools" extension. Once that’s installed, you’ll set up a debug configuration (launch.json) to tell VS Code how to connect to your app.
With the debugger attached, just click in the gutter next to any line number to drop a breakpoint. When your code hits that line, the app will pause, and VS Code will light up with the entire call stack, local variables, and closures. It's incredibly useful for untangling complex state logic or figuring out why a certain function is being called with the wrong props.
What if the bug isn't in your JavaScript at all? If you see a crash report screaming about an "unrecognized selector sent to instance" on iOS or a NullPointerException on Android, that’s your cue to look at the native layer.
.xcworkspace file in your ios directory with Xcode.android folder in Android Studio.Once you’re in the native IDE, you unlock a whole new level of debugging. You can see the raw, unfiltered device logs—Logcat in Android Studio and the Console in Xcode—which often contain the juicy crash details that Metro never shows you. Better yet, you can set breakpoints in native code (Swift, Objective-C, Java, or Kotlin). This is absolutely essential if you're working with custom native modules.
This workflow shows you exactly what’s happening when your JavaScript makes a call to the native side, helping you squash bugs related to data serialization or threading that are totally invisible from JS.
Hermes is React Native’s default JavaScript engine, and it’s built for speed. To debug it properly, you need a tool that can speak its language, and that tool is usually Chrome DevTools.
From the in-app Developer Menu, just tap Open Hermes Debugger. A new Chrome tab will pop up, connecting the DevTools inspector directly to the Hermes instance running in your app.
This is a huge step up from the old "Remote JS Debugging." When you connect to Hermes, your JavaScript keeps running on the device. Chrome DevTools is just a client looking in, so you don't get the performance weirdness that came from running your app's logic in the browser.
Inside this direct Hermes session, you can do some serious work:
This direct connection is the definitive way to profile your app's JS performance.
Knowing which tool to grab first can be tricky. This little decision tree should help you figure out where to start.
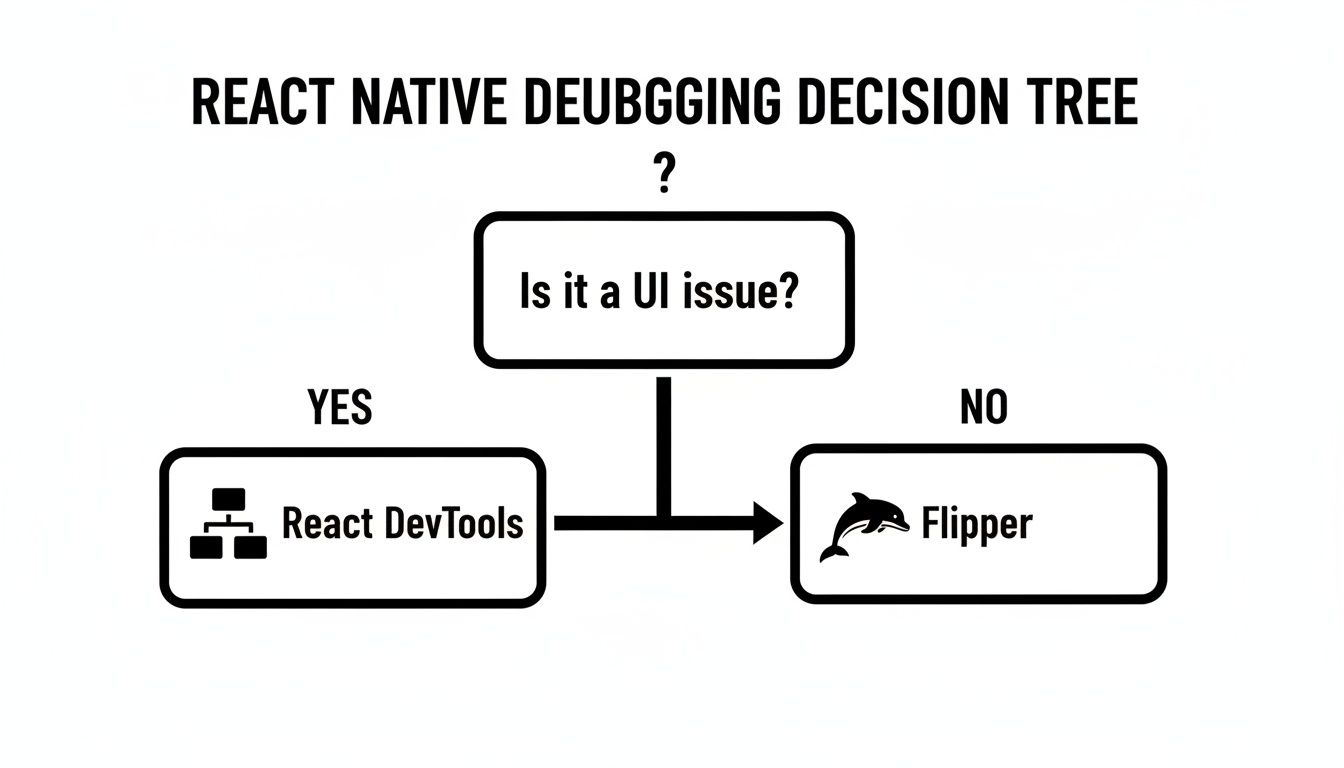
It’s a simple guide: if it’s a UI issue, start with React DevTools. For anything involving network requests or native layouts, Flipper is your best bet.
The debugging story has gotten so much better, especially with the New Architecture rolling out. In some production apps, this shift has cut bridge overhead by 20-30% for things like cold starts and scrolling. We can now profile JS thread stalls and UI lag with much more accuracy, helping to kill the "dread" factor that a Stack Overflow survey found, where 14% of developers feared React Native bugs more than Flutter's. You can read more about these wins and where the framework is headed in the annual recaps of React Native's progress.
Sooner or later, every one of us gets hit with the infamous red screen of death. It's frustrating, sure, but I've learned to see these errors as puzzles just waiting to be solved. If you can spot the common culprits, you can turn a show-stopping bug into a quick fix and get back to building.
A solid debugging strategy isn't about magic; it's about recognizing patterns and knowing exactly where to look first. Whether it's a silent network failure or a cryptic native build error, having a mental checklist saves hours of guesswork.
Let's be honest, this is probably the most common error in the entire JavaScript world. It’s the code equivalent of trying to grab something out of an empty box. All it means is you tried to access a property on a variable that was undefined.
When this screen pops up, your first instinct should be to trace the data flow. Ask yourself: where was this variable supposed to get its value?
undefined. A quick fix is to use optional chaining (data?.user?.name) or just wrap your component in a conditional check ({data && <Component />}).undefined by mistake. This is a perfect time to fire up React DevTools and inspect the component's state right at the moment of the crash. You'll see exactly what went wrong.When your API calls start failing, the problem is often completely outside your React Native code. The Network plugin in Flipper is your best friend here. It lets you inspect every single outgoing request, its headers, and the server's response. It’s an indispensable tool.
I’ve found it’s almost always one of these things:
By looking at the raw response in Flipper, you can immediately see if the server is sending back a 401 Unauthorized, 404 Not Found, or 500 Internal Server Error. That points you directly to the root of the problem.
I can't stress this enough: always check the Flipper Network tab before you start tearing apart your state management. The server response almost always holds the key.
Native build errors are easily the most intimidating. They pull you out of the familiar JavaScript environment and into a world of Gradle and Cocoapods. When npx react-native run-android or your Xcode build fails with a cryptic message, it's usually a dependency or configuration mismatch.
Your first move should always be to run npx react-native-doctor. This little command-line tool is a lifesaver. It checks your entire environment for common problems like outdated dependencies, incorrect Android SDK paths, or messed-up Cocoapods versions.
If the doctor gives you a clean bill of health, here’s my go-to checklist:
cd android && ./gradlew clean for Android. For iOS, a cd ios && pod deintegrate && pod install usually does the trick. A stale cache is the source of so many mysterious build failures.build.gradle or Info.plist.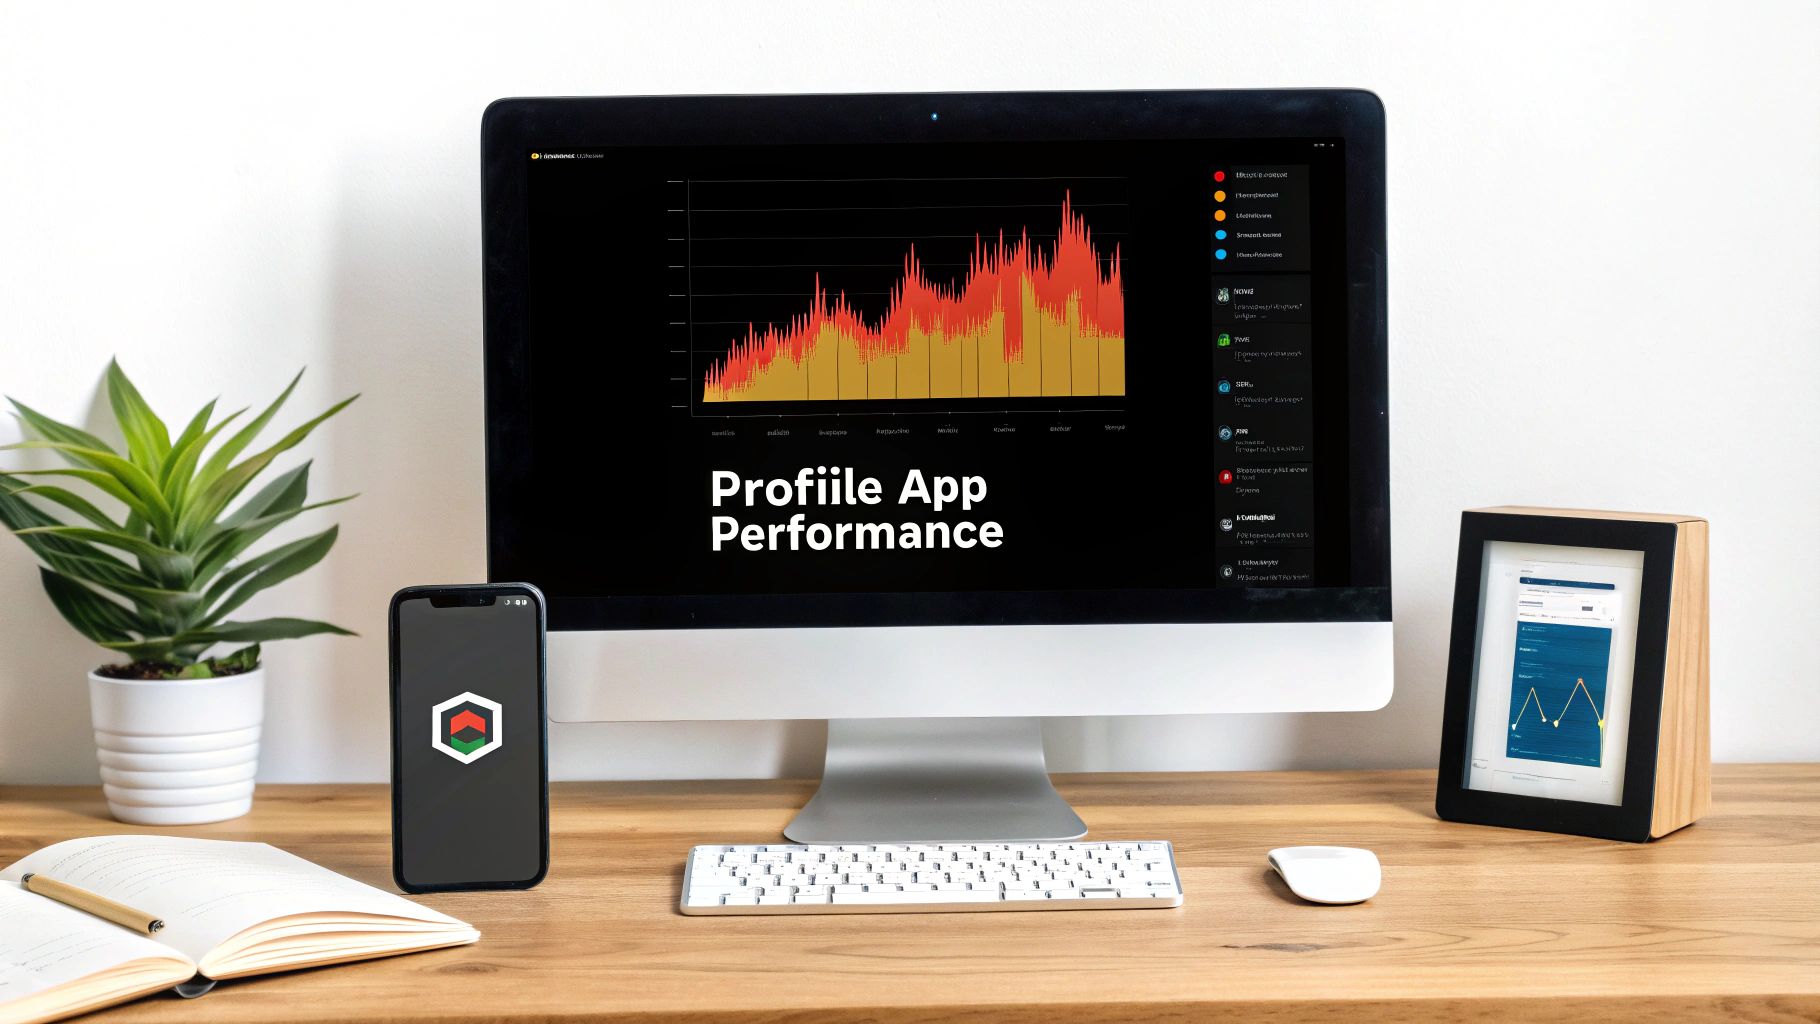
Fixing crashes gets your app stable, but that’s only half the battle. A truly great app needs to feel fast and fluid. This is where performance profiling comes in, shifting your react native debug sessions from fixing what's broken to optimizing what already works. After all, a sluggish interface or choppy animations can drive users away just as quickly as a hard crash.
Your primary tools for this job are the profilers baked into React DevTools and Flipper. They help you get answers to the most important questions: Which components are taking forever to render? Are they re-rendering when they absolutely don't need to? Where are the real bottlenecks that make the UI feel slow?
The React DevTools Profiler is your go-to for hunting down component render issues. Just open the "Profiler" tab in DevTools, hit the record button, and start interacting with your app. Once you stop recording, you’ll see a flame graph.
This graph is a powerful visual breakdown of your component tree's render times. You're looking for the tall, yellow-colored bars—those are the components that took the longest to render and are your prime suspects for optimization. When you click on a specific render in the graph, DevTools will tell you exactly which props changed to trigger the update. This is gold for spotting and eliminating unnecessary re-renders.
A classic performance killer I see all the time is passing new function instances as props on every single render. If your flame graph shows a component re-rendering constantly without any meaningful prop changes, it’s a massive red flag. The fix? Wrap your callback functions in
useCallbackor the component itself inReact.memo.
Once you've zeroed in on a slow component, React gives you the tools you need to prevent wasted work. These hooks are essential for any performance tuning.
React.memo: This is a higher-order component that’s deceptively simple. It basically tells a component not to re-render if its props haven't changed. It’s perfect for components that get rendered often with the same data.useCallback: This hook memoizes a function, preventing it from being re-created on every render. It’s absolutely critical when you're passing functions down as props to child components wrapped in React.memo.useMemo: If you have an expensive calculation in your component, useMemo is your friend. It memoizes the result, only re-running the calculation if one of its dependencies changes. This keeps your render logic lean and fast.Sometimes, the JavaScript thread is humming along just fine, but the app still feels sluggish. This often points to a bottleneck on the native UI thread. This is where Flipper’s Performance Profiler shines, letting you monitor both the JS and UI threads at the same time. The metric you really want to watch is the UI thread's frame rate. If it’s consistently dropping below 60 FPS, your app is going to feel choppy to the user.
This problem is especially common with long, data-heavy lists. While the built-in FlatList component is decent, for seriously high-performance scrolling you should check out a library like Shopify's FlashList. It’s engineered to recycle views instead of creating new ones for every item, which dramatically cuts down on memory usage and keeps the UI thread free enough to render buttery-smooth animations.
The developer experience for debugging has come a long way. It used to be a major hurdle in React Native, but tools like React DevTools have exploded in popularity, with weekly downloads now exceeding 85,340 in early 2025. The New Architecture has also been a game-changer, finally getting rid of the old bridge bottleneck. This allows for incredibly fluid, 60 FPS animations with libraries like Reanimated 2+. You can explore more on these trends and see the latest statistics in React development.
Great debugging isn't just a reactive skill you pull out when things go sideways; it's a proactive habit that keeps bugs from ever seeing the light of day. When you shift your mindset from firefighting to fire prevention, you naturally start building a more stable, maintainable codebase. This last piece of the puzzle is all about fostering a culture of quality that makes the entire development cycle smoother and faster for everyone.
This whole approach starts with writing code that’s easy to follow. Instead of littering your code with a generic console.log('here'), start writing meaningful logs that give you real context, like console.log('[UserProfile] Fetching data for user:', userId). This one small change turns your console from a chaotic mess into a clear, searchable story of your app's execution, which makes future react native debug sessions so much more efficient.
For those sneaky bugs that only pop up in the wild, you absolutely need a robust error reporting service. Tools like Sentry or Bugsnag are lifesavers here. They automatically capture crashes and performance hiccups from your production app and serve them up with stack traces and device info. Honestly, integrating one of these is non-negotiable for any serious project. Think of it as a black box recorder for your app, giving you the critical data to squash bugs you otherwise would've never known existed.
Another killer tool for preemptive bug squashing is TypeScript. By enforcing types across your application, you wipe out an entire class of errors at compile time, long before your code even thinks about running.
Think of TypeScript as your first line of defense. It won't catch every logic error, but it virtually eliminates common runtime headaches like "undefined is not an object," freeing you up to focus on the truly complex problems.
Finally, a proactive mindset has to extend to your team's workflow. Creating a standardized, reproducible bug-reporting process is essential. A solid bug report isn't a vague complaint; it's a clear, actionable document.
Every good bug report should include:
This kind of discipline saves countless hours of back-and-forth. When your team spends less time chasing down elusive bugs and more time building features, you'll see a massive improvement in how to improve developer productivity. To really level up, it also helps to constantly improve your critical thinking, which lets you dissect problems more effectively. By adopting these habits, you move from just fixing bugs to building a foundation where fewer bugs can survive in the first place.
Even with the best tools in hand, you'll eventually run into the same handful of head-scratchers that every other React Native dev has faced. Let's get those common questions answered so you can get back to coding.
Getting your app running on a real phone is the only way to test certain things. The good news is, it's pretty straightforward.
First, plug your device in via USB.
Once your app is up and running, just give the device a good shake. This brings up the Developer Menu, where you can tap to start remote debugging, fire up the Performance Monitor, and access other essential tools. This is non-negotiable for testing hardware features like the camera or Bluetooth.
This is a big one. At first glance, they seem to do similar things, but they operate on totally different levels.
Chrome DevTools is your go-to for the JavaScript side of your app. Think of it as your pure JS sandbox—you can set breakpoints, dig through console.log output, and check out network requests. It’s laser-focused on your app's logic.
Flipper, on the other hand, is a much bigger beast. It does everything Chrome DevTools can for your JavaScript, but its real power is in seeing what's happening on the native side. With Flipper, you can inspect native UI layouts, watch device logs (Logcat for Android, Console for iOS) in real-time, and even diagnose native crashes. It's the complete package.
The bottom line is simple: use Chrome DevTools for quick and dirty JS debugging (it’s especially great with Hermes). But when you need to understand the full picture—JavaScript and native—Flipper is the indispensable tool for the job.
If you've ever felt like your app is crawling through mud while debugging, you're not imagining it. It runs way slower in debug mode for a very specific reason.
Normally, your JavaScript code runs directly on the device using a highly optimized engine like Hermes. But when you start debugging, that all changes. The code is actually executed on your computer's V8 engine (the one powering Chrome), and every single bit of communication has to travel back and forth across the Metro bridge.
This round-trip creates a ton of latency, making everything feel sluggish. That's why you should always test performance in a release build or at least with the JS debugger turned off. It’s the only way to get a true feel for how your app will perform for your users.
Ready to build your next app without the boilerplate? gluestack market offers a huge library of production-ready React Native templates and UI kits. Ship your cross-platform app faster today!

Feb 23, 2026
4 min read
Discover powerful mobile app monetization strategies to boost your revenue. Our guide covers IAPs, ads, and subscriptions for React Native apps and beyond.

Feb 22, 2026
4 min read
A clear guide to app development cost estimation. Learn what drives costs, see budget examples, and discover strategies to build your app for less.

Feb 21, 2026
4 min read
Discover how to promote mobile application effectively with proven ASO, paid campaigns, and retention strategies.

Feb 15, 2026
4 min read
Discover how to create a prototype of a website with a practical, step-by-step guide. Explore tools, testing methods, and tips to bring your idea to life.

Feb 14, 2026
4 min read
Confused about mockups vs wireframes? Learn the key differences, when to use each, and how to streamline your React Native app development workflow.

Feb 13, 2026
4 min read
Discover how mobile apps templates accelerate development. Learn to choose, customize, and deploy high-quality React Native templates for your next project.

Feb 12, 2026
4 min read
Explore mobile application interface design with practical tips, core principles, and platform-aware workflows to craft apps users love.

Feb 10, 2026
4 min read
Learn mobile first design principles to craft fast, accessible apps that delight users. Practical tips, examples, and testing strategies.

Feb 08, 2026
4 min read
Explore the progressive web app vs native debate with our in-depth guide. We compare performance, cost, and UX to help you make the right strategic choice.
Feb 07, 2026
4 min read
Discover how React Native templates can accelerate your app development. This guide explores choosing, customizing, and deploying templates for faster launches.

Feb 05, 2026
4 min read
Discover the key differences between expo vs react native, including workflow, builds, and performance to help you pick the right path for your app.
Feb 03, 2026
4 min read
Master image with text overlay in React Native with responsive, accessible patterns. Learn expo setup, NativeWind styling, and gluestack-ui examples.

Feb 03, 2026
4 min read
Discover cross platform app development with proven strategies to build faster for iOS, Android, and the web using a single, unified codebase.

Feb 01, 2026
4 min read
Learn how to make an app for my business quickly with template-based steps from planning to launch, plus tips to scale and optimize.

Jan 31, 2026
4 min read
Ready to build an app? This guide shares practical strategies for validating your idea, choosing a tech stack, and navigating the App Store launch.

Jan 30, 2026
4 min read
Master responsive design for mobile apps with this guide on fluid layouts, breakpoints, and React Native. Build UIs that adapt perfectly to any screen.

Jan 25, 2026
4 min read
Learn how to design an Android app that stands out. This guide covers UX research, wireframing, Material Design, and the developer handoff process.

Jan 24, 2026
4 min read
Explore ui design web essentials: a complete guide to principles, responsive patterns, and workflows for intuitive, engaging web interfaces.

Jan 23, 2026
4 min read
Discover 10 essential mobile app design best practices for building exceptional cross-platform apps. Actionable tips for UI, UX, navigation, and performance.

Jan 21, 2026
4 min read
Discover how to debug React Native apps effectively. This guide covers Flipper, React DevTools, and native code troubleshooting for faster development cycles.

Jan 20, 2026
4 min read
Learn how to create app for your business with a practical, modern approach. Plan, customize, and launch with proven steps.

Jan 19, 2026
4 min read
A complete guide to mobile app development for startups. Learn how to validate your idea, build an MVP, and launch a successful app faster and more affordably.

Jan 18, 2026
4 min read
Discover how to choose the right React website template to accelerate your project. Our guide covers everything from quality checklists to deployment.
Jan 17, 2026
4 min read
Discover how to choose, customize, and deploy a React Native app template. This guide provides practical steps for launching production-ready apps faster.

Jan 16, 2026
4 min read
Discover how mobile application templates accelerate development. This guide covers how to choose, customize, and launch your app with the right foundation.

Jan 13, 2026
4 min read
Start your journey in mobile app development for beginners. This guide breaks down how to build your first cross-platform app with React Native and Expo.

Jan 12, 2026
4 min read
Explore the best react native ui libraries and compare features, performance, and ease of use to pick the right toolkit for your app.

Jan 11, 2026
4 min read
Launch your own ride-hailing service with our guide to building a production-ready Uber app clone. Learn MVP strategy, tech stacks, and backend integration.

Jan 10, 2026
4 min read
Master modern cash app design with this guide. Learn the UI/UX, security, and React Native strategies needed to build a fintech app that users trust and love.

Jan 09, 2026
4 min read
Learn how to build a personal finance dashboard with React Native. A practical guide for developers on UI design, data architecture, and production readiness.

Jan 08, 2026
4 min read
A practical guide to building a cross-platform event check in app with React Native. Learn to implement QR scanning, offline sync, and deployment.

Jan 07, 2026
4 min read
Master linear gradient React Native components with our complete guide. Learn practical techniques for Expo, bare RN, and NativeWind to build stunning UIs.

Jan 06, 2026
4 min read
Learn how to change application name in your React Native & Expo projects. This guide covers display names, package IDs, and app store listings.

Jan 05, 2026
4 min read
Discover how to monetize mobile apps with our founder's guide. Learn proven React Native strategies for ads, IAPs, and subscriptions to maximize your revenue.

Jan 04, 2026
4 min read
A practical guide on how to create a website app with a single codebase. Learn to build for web, iOS, and Android using React Native, Expo, and TypeScript.

Jan 03, 2026
4 min read
Learn how to create an app for your business with this definitive guide. Discover practical strategies for validation, development, and launch that work.

Jan 02, 2026
4 min read
Learn how to create a wireframe for a website with this practical guide. Move from initial sketches to developer-ready designs that get built right.
Jan 01, 2026
4 min read
Deciding on progressive web application vs native? This guide offers a deep comparison of performance, cost, UX, and use cases to help you choose wisely.

Dec 31, 2025
4 min read
Discover 10 mobile app security best practices for React Native. Learn to secure data, APIs, and code with actionable tips and examples for 2025.

Dec 30, 2025
4 min read
Unlock the real React Native app development cost. Our guide breaks down pricing by feature, team, and complexity to help you budget with confidence.

Dec 28, 2025
4 min read
The ultimate React Native tutorial for beginners. Learn to build beautiful cross-platform apps using a modern stack like Expo, TypeScript, and gluestack-ui.

Dec 27, 2025
4 min read
A practical guide on how to build a mobile app. Learn to go from concept to a market-ready app using templates, React Native, and proven development strategies.

Dec 26, 2025
4 min read
Discover interface design for websites with actionable tips on layout, responsiveness, and usability to boost conversions.

Dec 25, 2025
4 min read
Discover designs for apps that blend minimal aesthetics with personalization, and learn to build user-centric interfaces that boost engagement.

Dec 24, 2025
4 min read
Learn graphical interface design - essentials for mastering core principles, modern workflows, and cross-platform strategies to build intuitive, engaging UIs.

Dec 23, 2025
4 min read
Discover how high fi wireframes bridge the gap between ideas and code. Learn a practical workflow for creating, testing, and handing off effective UI designs.

Dec 22, 2025
4 min read
Discover mobile app interface design with practical principles, accessibility, and workflows that boost user engagement.

Dec 21, 2025
4 min read
Explore the top 10 UI UX design trends for 2025. Get expert insights and practical React Native tips to build next-gen cross-platform apps that stand out.

Dec 20, 2025
4 min read
Discover how mobile app templates accelerate development from idea to launch. Learn to select, customize, and deploy templates for a faster time to market.

Dec 18, 2025
4 min read
Explore the best react native ui libraries to accelerate mobile development with performance, theming, and accessibility. Expert tips inside.
Dec 16, 2025
4 min read
Master React Native PDF handling. Learn to generate, view, and share PDFs with practical code examples, library comparisons, and performance tips.
Dec 15, 2025
4 min read
A practical guide to choosing the right React Native component library. Learn how to evaluate options, avoid common pitfalls, and build apps faster.

Dec 14, 2025
4 min read
Find the perfect React Native UI library for your project. This guide compares top libraries, selection criteria, and customization strategies.

Dec 13, 2025
4 min read
Learn how to change app name in React Native and Expo. Our guide covers display names, bundle IDs, and store listings for iOS and Android projects.

Dec 12, 2025
4 min read
Discover the best React Native component library for your next project. We compare top libraries on performance, customization, and real-world use cases.

Dec 11, 2025
4 min read
Discover how to choose the right React Native UI kit. This guide covers top kits, selection criteria, and customization to accelerate your app development.

Dec 10, 2025
4 min read
Explore our in-depth guide to find the best React Native UI library. We compare top contenders to help you choose the right fit for your project.
Dec 09, 2025
4 min read
Discover a practical approach to building apps with React Native. This guide covers setup, UI, state management, and testing to help you ship great apps.

Dec 08, 2025
4 min read
android login with facebook: Learn to set up the Facebook SDK, manage tokens, and implement secure authentication across native Android, cross-platform apps.

Dec 07, 2025
4 min read
Master the alert in React Native. Learn to handle platform differences, build custom modals, and apply best practices for a seamless user experience.
Dec 06, 2025
4 min read
keyboardavoidingview react native: Master keyboard handling with KeyboardAvoidingView across iOS, Android, Expo, and TypeScript.

Dec 05, 2025
4 min read
A practical guide to implementing a React Native PDF viewer. Learn to compare libraries, handle native setup, and troubleshoot common issues with real code.

Dec 04, 2025
4 min read
how to validate startup idea: learn proven methods like customer interviews, MVPs, and metrics to confirm market fit.

Dec 03, 2025
4 min read
how to make app like uber: Learn core features, tech stack, development steps, testing, and launch tips.

Dec 02, 2025
4 min read
Build a rock-solid React Native setup. This guide covers Expo vs. Bare workflows, TypeScript, pnpm monorepos, NativeWind, and deployment strategies.

Dec 01, 2025
4 min read
A practical guide to Stripe React Native integration. Learn to set up your server, build payment UIs, handle webhooks, and launch secure mobile payments.

Nov 30, 2025
4 min read
Learn how to master push notifications in React Native. This guide covers setup, best practices, and advanced techniques for engaging your users.

Nov 29, 2025
4 min read
Build powerful location-based apps with our practical guide to react native with google maps. Get setup guides, pro tips, and best practices for iOS & Android.

Nov 28, 2025
4 min read
Explore deep linking react native with a practical guide to configuring URL schemes, universal links, navigation, and testing for Expo and bare apps.

Nov 28, 2025
4 min read
A practical guide to building a scalable React Native design system. Learn to implement tokens, theming, and tools like NativeWind and gluestack-ui.

Nov 26, 2025
4 min read
Learn why react native expo templates speed up your projects with ready-made patterns and practical tips.

Nov 25, 2025
4 min read
Discover how to improve developer productivity with actionable strategies for workflow, tooling, and culture. A practical guide for software engineering teams.

Nov 24, 2025
4 min read
Discover the best cross platform app development tools. Compare top frameworks like Flutter and React Native to build and ship apps faster.

Nov 23, 2025
4 min read
This Expo React Native tutorial provides a hands-on guide to building cross-platform apps. Learn setup, styling with NativeWind, navigation, and deployment.

Nov 22, 2025
4 min read
Build beautiful UIs faster with this guide to Tailwind CSS React Native. Learn setup, styling, and advanced techniques with NativeWind for mobile apps.

Nov 21, 2025
4 min read
Explore our curated list of 7 top-tier React Native app examples. Discover production-ready templates and resources to build your next app faster.

Mar 19, 2025
4 min read
gluestack market offers React Native UI templates to accelerate development. Get customizable, production-ready React Native app templates and Ui kit, some free. Build faster & smarter today!