Let’s face it—debugging can feel like chasing ghosts when your app crashes without a trace. A solid approach pairs JavaScript inspection with native-layer analysis. Think of using Chrome DevTools to step through your code, then flipping over to Flipper or Xcode/Android Studio logs for the platform-specific view. Nail that combo, and you’ll turn frustrating bugs into quick wins in both Expo and bare React Native projects.
Reframing debugging from “necessary evil” to a core craft changes everything. Instead of gritting your teeth over each error, you begin to see roadblocks as chances to fortify your app’s reliability and performance.
Bulletproof debugging delivers:
Stop sprinting after bugs—learn to investigate them strategically. That means mapping out your component’s state, tracing its interactions with the native layer, and systematically ruling out possibilities. This mindset is indispensable as React Native matures. After all, more than 25,116 companies rely on it to ship mobile apps.
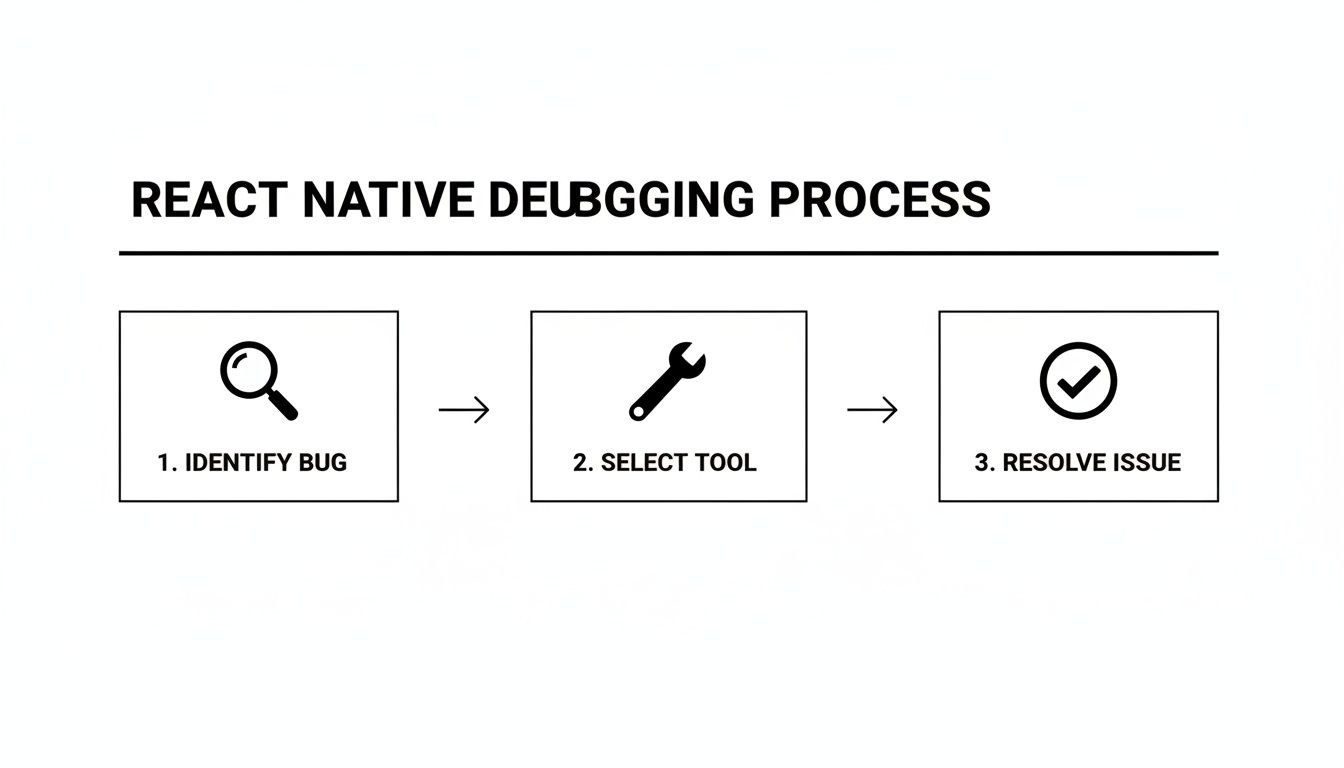
A clear process boils down to three stages:
For a deep dive into tracing issues from symptom to solution, check out Mastering Root Cause Analysis Engineering. If you’re new to React Native, our beginner’s guide will get you up to speed: https://market.gluestack.io/blog/react-native-tutorial-for-beginners.
Before you jump into a breakdown of each workflow, here’s a quick summary of the core tools, their primary use cases, and which environments they shine in:
| Tool | Primary Use Case | Best For Expo Go | Best For Bare RN |
|---|---|---|---|
| Chrome DevTools | Inspect JS code, set breakpoints | ✅ | ✅ |
| Flipper | Native logs, layout inspection | ❌ | ✅ |
| VS Code Debugger | Attach to Metro, JS/TS breakpoints | ✅ | ✅ |
| React DevTools | Component tree, props/state inspection | ✅ | ✅ |
| Xcode Console | Native crash logs, LLDB debugging | ❌ | ✅ |
| Android Studio Logcat | Native logs, thread analysis | ❌ | ✅ |
This snapshot will help you decide at a glance which tool to fire up next. In the sections ahead, we’ll unpack how to configure each one, sprinkle in real-world troubleshooting tips, and share quick-check lists to keep you moving. Enjoy the journey from silent failures to swift resolutions!
Every one of us starts with console.log. It’s the trusty multitool of debugging for a reason—it’s fast, simple, and it just works. But if you really want to get a handle on debug react native apps efficiently, you’ve got to move beyond just printing strings to the terminal. Building a solid JavaScript debugging practice is hands-down the fastest way to squash logic errors, untangle state mysteries, and figure out why that component just isn’t behaving.
A great first step is simply upgrading your console game. Instead of leaning on console.log for everything, its more descriptive cousins can give you much clearer signals.
console.warn('Possible issue here'): This pops a yellow warning in the console, making potential problems stand out from the noise of standard logs.console.error('This is a critical failure'): This throws a big red error box, immediately grabbing your attention for serious issues.console.table({ id: 1, user: 'Jane' }): Got an array or object you need to inspect? This is a lifesaver. It formats your data into a clean, readable table right in the console.These simple commands bring order to the chaos of your logs, helping you spot what matters in a fraction of the time.
While smarter logs are a good start, the real magic happens when you can pause time. That’s essentially what you get with the interactive debugger in Chrome DevTools. It provides a full-blown environment where you can freeze your app's execution, inspect every variable in real-time, and walk through your code line by line.
Getting it connected is pretty straightforward. Once your app is running in a simulator or on a device, just pop open the in-app developer menu. On an iOS simulator, the shortcut is Cmd + D. For Android emulators, it’s Cmd + M (on macOS) or Ctrl + M (on Windows/Linux). From there, hit "Debug" or "Debug JS Remotely".
This will fire up a new tab in your Chrome browser, which is now hooked into your app's JavaScript thread. Head over to the "Sources" tab, and you'll see your project's file structure. You can navigate to the exact component you're troubleshooting and set breakpoints just by clicking on a line number.
A breakpoint is like a stop sign for your code. When the JavaScript engine hits it, execution halts completely. This gives you a live snapshot of your application's state at that precise moment. You can hover over variables to see their values, inspect the call stack to understand the execution path, and use the controls to step through the code one line at a time.
This level of control is a game-changer for untangling complex logic, especially with tricky state updates or async operations where a simple log just won’t cut it.
For a lot of us, constantly jumping between a code editor and a browser is a real flow-killer. The good news is that you can pull all that debugging power directly into Visual Studio Code. This setup lets you set breakpoints, inspect variables, and control execution right alongside the code you're writing.
To make this happen, you'll need to create a launch.json file inside a .vscode folder at the root of your project. This file is just a set of instructions telling the VS Code debugger how to connect to your React Native app's Metro server.
Here’s a standard launch.json configuration that works for most React Native projects:
{
"version": "0.2.0",
"configurations": [
{
"name": "Debug iOS",
"cwd": "${workspaceFolder}",
"type": "reactnative",
"request": "launch",
"platform": "ios"
},
{
"name": "Debug Android",
"cwd": "${workspaceFolder}",
"type": "reactnative",
"request": "launch",
"platform": "android"
}
]
}
Once that file is in place, just switch to the "Run and Debug" panel in VS Code's sidebar, pick the right configuration (like "Debug iOS"), and hit the play button. VS Code will handle building the app and attaching the debugger automatically. If you need a refresher on getting your environment ready, our guide on setting up a React Native project is a great place to start.
The screenshot below gives you a feel for what the VS Code debugging interface looks like with active breakpoints.
This integrated setup creates a powerful, unified workflow where you write, run, and debug your app without ever leaving your editor. The whole ecosystem is built around great developer tooling, and you can see it in the adoption numbers. React DevTools alone is downloaded over 85,340 times a week, which shows just how essential a solid debugging toolkit is for modern development. You can find more React development statistics and insights here.
When bugs live beyond your JavaScript logic, you need a tool that can bridge the gap to the native side. This is precisely where Flipper shines. Think of it as a powerful diagnostic platform for your iOS and Android apps, giving you a direct window into native logs, UI hierarchies, and network traffic—all in one place.

Unlike JS-centric tools, Flipper is built to inspect the entire application. That makes it indispensable for bare React Native projects where you’re frequently dipping into native modules. Setting it up is a pretty quick, one-time configuration in your native project files.
First things first, you'll need to grab the Flipper desktop application and get it installed. With that ready, you'll just need to add a bit of configuration to your native projects so they know how to talk to the Flipper app.
For iOS:
Your Podfile is the main entry point here. You’ll add the use_flipper! helper, which is smart enough to pull in the necessary dependencies and configure them when you run pod install. It’s a remarkably straightforward setup that does most of the heavy lifting for you.
For Android:
Over on the Android side, the setup is handled in your Gradle files. Typically, you'll add Flipper's dependencies to your app/build.gradle and then initialize it inside your MainApplication.java (or .kt) file. Just make sure to wrap that initialization in a check so it only runs for debug builds—you don't want to ship this in production.
After you've configured both platforms, just run npx react-native run-ios or npx react-native run-android. Your app should pop up automatically in the Flipper desktop client. If it doesn't connect right away, a quick app reload or a full rebuild usually sorts it out.
Flipper's real power comes from its plugin architecture. While the community has built tons of useful plugins, a few core ones are absolutely essential for any serious effort to debug React Native applications.
adb logcat or scrolling endlessly through the Xcode console. You get a clean, searchable, and filterable interface for both native and JavaScript console.log messages, all in one unified view.The ability to see your component hierarchy, native logs, and API calls side-by-side completely transforms your debugging workflow. Instead of jumping between three different tools, Flipper centralizes everything, helping you connect the dots between a user action, a network request, and a native log entry much, much faster.
Flipper also plays incredibly well with other essential tools, acting as a central hub for all your debugging activities. The best example of this is its built-in support for React DevTools.
Instead of running the standalone DevTools application, you can simply enable the "React DevTools" plugin right inside Flipper. This embeds the familiar Components and Profiler tabs directly into the Flipper interface.
This integration is a huge win. You can inspect your React component tree and its props or state, then immediately switch over to the Layout Inspector to see how that component was rendered into native views. Or, you can watch a network request in the Network plugin while simultaneously observing the state changes it triggers in the React DevTools plugin.
This unified approach is a game-changer for complex bugs where the problem sits at the intersection of JavaScript logic, native rendering, and external data. It streamlines your process, cuts down on context switching, and ultimately helps you squash bugs faster. For anyone working on bare React Native projects, mastering Flipper isn't just helpful—it’s essential.
A bug-free app is a solid start, but a fast, bug-free app is what really makes users happy. When your app feels sluggish or stutters through animations, the root cause is often buried deep in your component tree. This is exactly when React DevTools goes from a simple inspection tool to your best friend for performance tuning. It gives you an x-ray view into how your components render, helping you hunt down and squash those pesky bottlenecks.
First things first, you need to get the standalone DevTools app connected to your project. You can install it globally right from your terminal.
npm install -g react-devtools
With that installed, just pop open a new terminal window and run react-devtools. This launches a desktop app that’s now listening for a connection. Fire up your React Native app in a simulator or on a device, pull up the developer menu, and tap "Open Debugger." It should automatically link up with the DevTools instance you just started.
The React ecosystem is absolutely massive—we're talking over 11 million websites built on it, giving it a whopping 45.8% market share among JavaScript libraries. That scale is a testament to how mature and powerful its tooling has become. You can dig into more of these ReactJS statistics to see just how deep the community support goes.
Think of the "Components" tab as a live blueprint of your app's UI. It perfectly mirrors your code's component structure, letting you click on any element to see its current props, state, and hooks in real-time. This is a lifesaver for tracking down UI bugs.
Let's say a button isn't displaying the right text. You can find that button in the DevTools tree, select it, and instantly see what value its title prop is receiving. Is it what you expected? You can even tweak props and state values directly in the panel to test fixes on the fly without ever reloading your app. It’s an incredibly fast way to debug react native visual glitches.
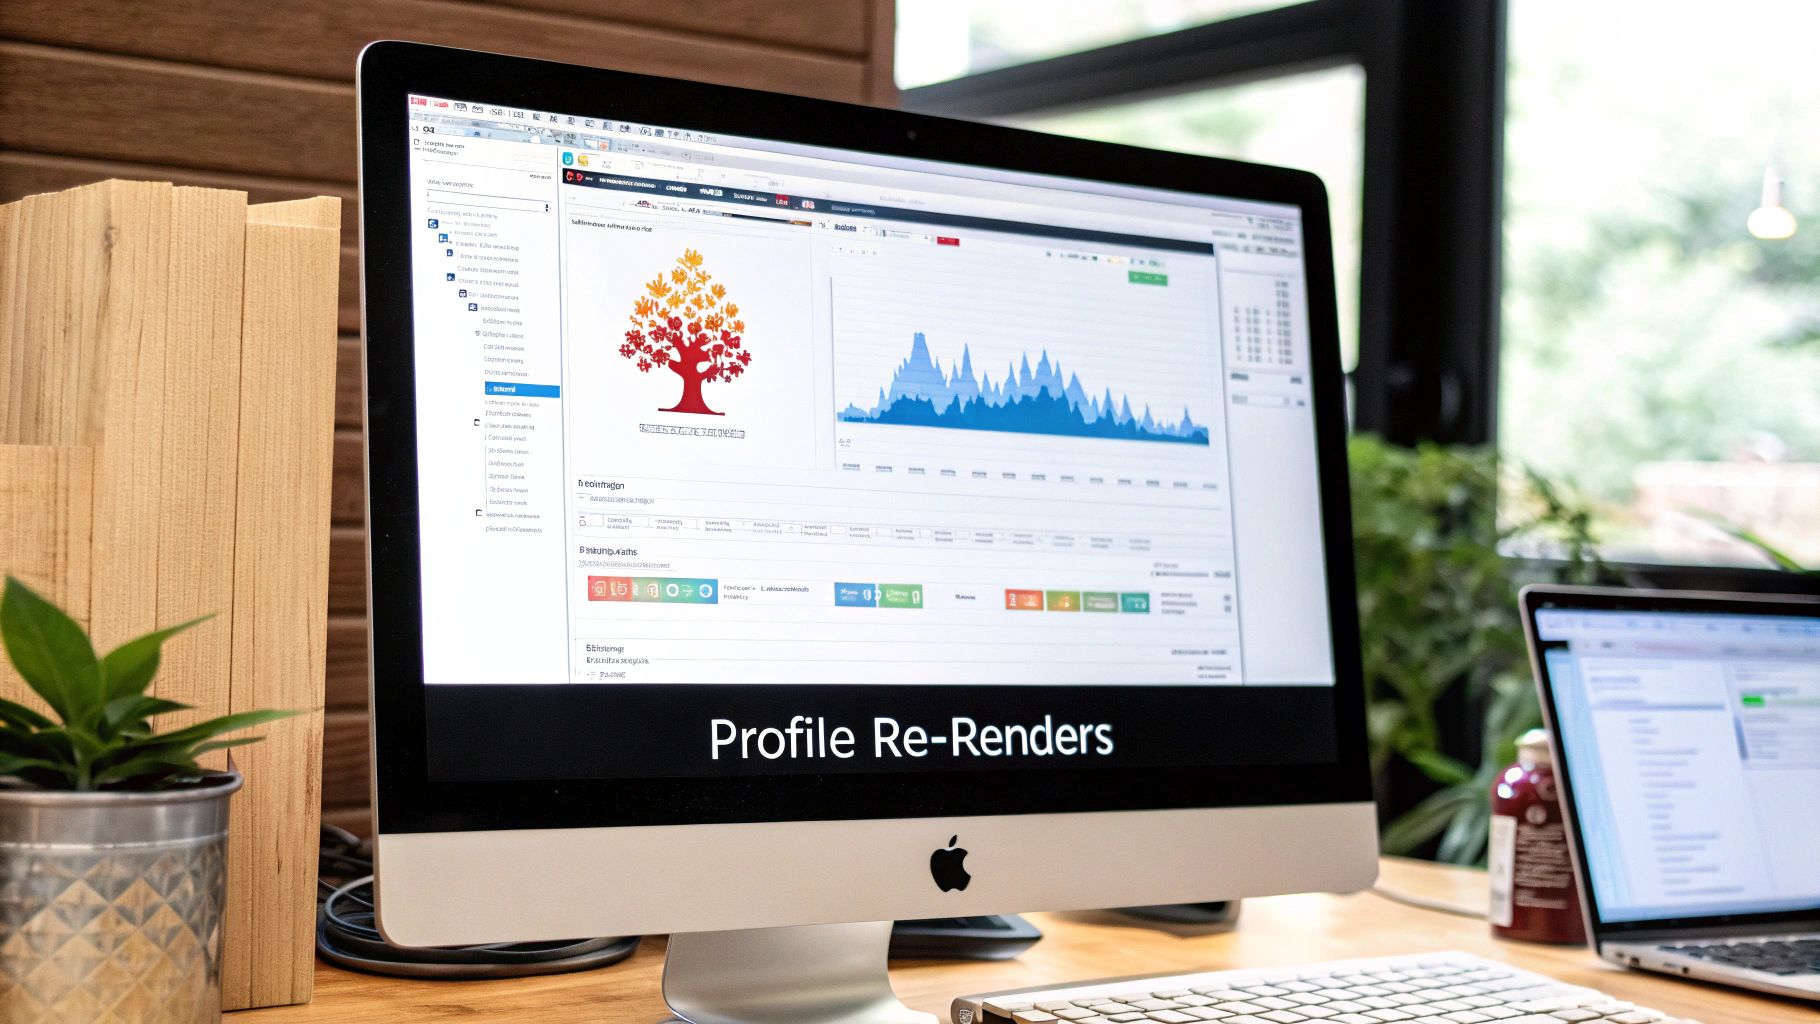
While the Components tab shows you the current state of things, the "Profiler" tab is all about understanding how that state changes over time. This is your secret weapon against unnecessary re-renders—one of the most common culprits behind performance issues in React Native.
Using it is simple. Just hit the little record button in the Profiler tab, then perform an action in your app, like scrolling a long list or tapping a button that triggers a big state update. Once you stop recording, DevTools will serve up a "flame graph."
Here’s a look at a typical Profiler flame graph after recording a user interaction.
Every bar in this graph is a component that rendered during your recording. The bar's color tells you how long it took to render, while its width shows how much time it took relative to everything else.
By looking at the flame graph, you can immediately spot which components are re-rendering when they have no business doing so. A long, bright yellow bar for a component that didn't visually change is a dead giveaway that you've found an opportunity to optimize.
Armed with this knowledge, you can make targeted fixes. Maybe you need to wrap a component in React.memo to stop it from re-rendering if its props are the same. Or perhaps it's time to use the useCallback and useMemo hooks to memoize functions and values, preventing a chain reaction of useless renders in child components. The Profiler doesn't just tell you there's a problem; it points you right to the code that needs a little TLC.
When your app just disappears from the screen without a single JavaScript error, you've officially entered the world of native crashes. These are, hands down, some of the trickiest problems to solve in React Native because the culprit isn’t in your component logic. It's hiding deep in the underlying iOS or Android platform code.
This is where you have to look beyond the Metro console and get your hands dirty with platform-specific logs. Native crashes can feel like a black box, but they almost always leave a breadcrumb trail. Your job is to find it.
For Android, your go-to command-line tool is adb logcat. Firing this up in your terminal unleashes a torrent of system-level messages from your device or emulator. On its own, the stream is pure noise, making it nearly impossible to spot the crash details.
The secret is filtering it down. You can pipe the output through grep to isolate messages for your app's package name or hunt for keywords like "Fatal" or "Exception."
A much cleaner approach is to clear the logs right before you trigger the crash.
adb logcat -c.adb logcat *:E to show only error-level messages.This focused output usually contains the Java or Kotlin stack trace that points directly to the misbehaving native module or configuration.
Over on the iOS side, Xcode is your command center. When a native crash happens on a simulator or a connected device, Xcode automatically scoops up a detailed crash report, complete with a full stack trace, thread states, and device info.
To get to these reports:
You'll see a list of all crash reports, neatly organized by app and time. Click on a report, and you'll get the stack trace. Your eyes should go straight to the thread that crashed (it’s usually marked "Thread 0 Crashed"). Read the function calls from the bottom up to piece together what went wrong.
Native stack traces look intimidating, I know. But you’re really just looking for the last function call that mentions your app's name or a third-party library you've installed. That’s often the clue that points you to a misconfigured native module or a buggy library version.
While a crash can happen for a million reasons, a few usual suspects pop up again and again in React Native development.
AndroidManifest.xml (like camera access) or missing a key in Info.plist on iOS is a classic way to cause an instant crash the moment a feature is used.pod install in the ios directory or a Gradle sync in Android Studio can often fix these linking headaches.If you're just starting, getting the project setup right from the beginning can help you dodge many of these configuration landmines. For a solid walkthrough, check out our Expo and React Native tutorial for beginners.
Even with the best tools, you're bound to hit a few common snags. It just comes with the territory. Let's walk through some of the most frequent questions and roadblocks developers run into, with practical answers to get you moving again.
This is, without a doubt, the most common headache. You hit "Debug JS" and... nothing. The good news is the fix is usually simple, and it almost always comes down to a network issue.
First thing's first: make sure your development machine and your device or simulator are on the exact same Wi-Fi network. A surprising number of connection failures boil down to this simple oversight.
If you've confirmed they're on the same network, the next usual suspect is a port conflict. The Metro bundler needs port 8081 to do its job. If another app is squatting on that port, the debugger can't establish a connection. You can sniff out a conflict by running lsof -i :8081 on macOS or Linux. If something else is using it, you can either shut that process down or just tell Metro to use a different port: npx react-native start --port=8082.
Still no luck? Here are a few more tricks to try:
npx react-native start --reset-cache.adb reverse tcp:8081 tcp:8081 command will do the trick.Seeing what your app is sending and receiving over the network is non-negotiable for building anything complex. For bare React Native projects, Flipper is the undisputed champion. Its Network plugin is brilliant—it intercepts and logs every API call your app makes, giving you a clean interface to inspect headers, payloads, and responses right out of the box.
If you're in an Expo Go project or just need a quick look, the "Network" tab in Chrome DevTools is a solid alternative. As long as you have JS debugging enabled, it will dutifully capture any fetch or XMLHttpRequest calls happening on the JavaScript thread.
For the really tricky situations, you might need to bring in the heavy artillery. Dedicated proxy tools like Charles or Proxyman give you god-mode control over your device's network traffic. You can inspect, modify, throttle, or even block requests to simulate flaky connections or test how your app handles specific API errors.
The new DevTools experience that landed with React Native 0.83 now includes its own built-in Network panel. It’s a huge step forward, aiming to bring Flipper-like inspection right into the core tooling. You get timings, headers, and even the line of code that kicked off the request.
This is a clear signal that the core team is focused on creating a more unified and powerful default debugging experience for everyone.
Debugging in production is a whole different ballgame. Your JavaScript is minified and mangled for performance, so stack traces look like gibberish. You can't just attach Chrome DevTools and step through code.
The industry-standard approach here is to lean on a third-party error monitoring service.
The workflow is straightforward. When you create a release build, you also generate JavaScript source maps and upload them to your chosen service. When a user's app crashes, the service catches the minified stack trace, uses your source maps to make it readable again, and presents you with a bug report you can actually use. This is the only reliable way to debug React Native issues that only show up in the wild.
For native crashes, don't forget the app stores themselves. Both the Google Play Console and Apple's App Store Connect have tools for analyzing native crash logs sent from user devices. This is your window into bugs hiding in your Java/Kotlin or Objective-C/Swift code.
Ready to skip the boilerplate and launch a production-ready app faster? The templates from gluestack market give you a massive head start. Built with TypeScript, NativeWind, and gluestack-ui, our kits provide the high-quality foundation you need for your next project. Explore the marketplace and find your perfect starting point today.

Feb 23, 2026

4 min read
Discover powerful mobile app monetization strategies to boost your revenue. Our guide covers IAPs, ads, and subscriptions for React Native apps and beyond.

Feb 22, 2026
4 min read
A clear guide to app development cost estimation. Learn what drives costs, see budget examples, and discover strategies to build your app for less.

Feb 21, 2026
4 min read
Discover how to promote mobile application effectively with proven ASO, paid campaigns, and retention strategies.

Feb 15, 2026
4 min read
Discover how to create a prototype of a website with a practical, step-by-step guide. Explore tools, testing methods, and tips to bring your idea to life.

Feb 14, 2026
4 min read
Confused about mockups vs wireframes? Learn the key differences, when to use each, and how to streamline your React Native app development workflow.

Feb 13, 2026
4 min read
Discover how mobile apps templates accelerate development. Learn to choose, customize, and deploy high-quality React Native templates for your next project.

Feb 12, 2026
4 min read
Explore mobile application interface design with practical tips, core principles, and platform-aware workflows to craft apps users love.

Feb 10, 2026
4 min read
Learn mobile first design principles to craft fast, accessible apps that delight users. Practical tips, examples, and testing strategies.

Feb 08, 2026
4 min read
Explore the progressive web app vs native debate with our in-depth guide. We compare performance, cost, and UX to help you make the right strategic choice.
Feb 07, 2026
4 min read
Discover how React Native templates can accelerate your app development. This guide explores choosing, customizing, and deploying templates for faster launches.

Feb 05, 2026
4 min read
Discover the key differences between expo vs react native, including workflow, builds, and performance to help you pick the right path for your app.
Feb 03, 2026
4 min read
Master image with text overlay in React Native with responsive, accessible patterns. Learn expo setup, NativeWind styling, and gluestack-ui examples.

Feb 03, 2026
4 min read
Discover cross platform app development with proven strategies to build faster for iOS, Android, and the web using a single, unified codebase.

Feb 01, 2026
4 min read
Learn how to make an app for my business quickly with template-based steps from planning to launch, plus tips to scale and optimize.

Jan 31, 2026
4 min read
Ready to build an app? This guide shares practical strategies for validating your idea, choosing a tech stack, and navigating the App Store launch.

Jan 30, 2026
4 min read
Master responsive design for mobile apps with this guide on fluid layouts, breakpoints, and React Native. Build UIs that adapt perfectly to any screen.

Jan 25, 2026
4 min read
Learn how to design an Android app that stands out. This guide covers UX research, wireframing, Material Design, and the developer handoff process.

Jan 24, 2026
4 min read
Explore ui design web essentials: a complete guide to principles, responsive patterns, and workflows for intuitive, engaging web interfaces.

Jan 23, 2026
4 min read
Discover 10 essential mobile app design best practices for building exceptional cross-platform apps. Actionable tips for UI, UX, navigation, and performance.

Jan 20, 2026
4 min read
Learn how to create app for your business with a practical, modern approach. Plan, customize, and launch with proven steps.

Jan 19, 2026
4 min read
A complete guide to mobile app development for startups. Learn how to validate your idea, build an MVP, and launch a successful app faster and more affordably.

Jan 18, 2026
4 min read
Discover how to choose the right React website template to accelerate your project. Our guide covers everything from quality checklists to deployment.
Jan 17, 2026
4 min read
Discover how to choose, customize, and deploy a React Native app template. This guide provides practical steps for launching production-ready apps faster.

Jan 16, 2026
4 min read
Discover how mobile application templates accelerate development. This guide covers how to choose, customize, and launch your app with the right foundation.

Jan 13, 2026
4 min read
Start your journey in mobile app development for beginners. This guide breaks down how to build your first cross-platform app with React Native and Expo.

Jan 12, 2026
4 min read
Explore the best react native ui libraries and compare features, performance, and ease of use to pick the right toolkit for your app.

Jan 11, 2026
4 min read
Launch your own ride-hailing service with our guide to building a production-ready Uber app clone. Learn MVP strategy, tech stacks, and backend integration.

Jan 10, 2026
4 min read
Master modern cash app design with this guide. Learn the UI/UX, security, and React Native strategies needed to build a fintech app that users trust and love.

Jan 09, 2026
4 min read
Learn how to build a personal finance dashboard with React Native. A practical guide for developers on UI design, data architecture, and production readiness.

Jan 08, 2026
4 min read
A practical guide to building a cross-platform event check in app with React Native. Learn to implement QR scanning, offline sync, and deployment.

Jan 07, 2026
4 min read
Master linear gradient React Native components with our complete guide. Learn practical techniques for Expo, bare RN, and NativeWind to build stunning UIs.

Jan 06, 2026
4 min read
Learn how to change application name in your React Native & Expo projects. This guide covers display names, package IDs, and app store listings.

Jan 05, 2026
4 min read
Discover how to monetize mobile apps with our founder's guide. Learn proven React Native strategies for ads, IAPs, and subscriptions to maximize your revenue.

Jan 04, 2026
4 min read
A practical guide on how to create a website app with a single codebase. Learn to build for web, iOS, and Android using React Native, Expo, and TypeScript.

Jan 03, 2026
4 min read
Learn how to create an app for your business with this definitive guide. Discover practical strategies for validation, development, and launch that work.

Jan 02, 2026
4 min read
Learn how to create a wireframe for a website with this practical guide. Move from initial sketches to developer-ready designs that get built right.
Jan 01, 2026
4 min read
Deciding on progressive web application vs native? This guide offers a deep comparison of performance, cost, UX, and use cases to help you choose wisely.

Dec 31, 2025
4 min read
Discover 10 mobile app security best practices for React Native. Learn to secure data, APIs, and code with actionable tips and examples for 2025.

Dec 30, 2025
4 min read
Unlock the real React Native app development cost. Our guide breaks down pricing by feature, team, and complexity to help you budget with confidence.

Dec 29, 2025
4 min read
A practical guide to master your React Native debug workflow. Learn to use Flipper, React DevTools, and Hermes to solve bugs in Expo and bare RN apps.

Dec 28, 2025
4 min read
The ultimate React Native tutorial for beginners. Learn to build beautiful cross-platform apps using a modern stack like Expo, TypeScript, and gluestack-ui.

Dec 27, 2025
4 min read
A practical guide on how to build a mobile app. Learn to go from concept to a market-ready app using templates, React Native, and proven development strategies.

Dec 26, 2025
4 min read
Discover interface design for websites with actionable tips on layout, responsiveness, and usability to boost conversions.

Dec 25, 2025
4 min read
Discover designs for apps that blend minimal aesthetics with personalization, and learn to build user-centric interfaces that boost engagement.

Dec 24, 2025
4 min read
Learn graphical interface design - essentials for mastering core principles, modern workflows, and cross-platform strategies to build intuitive, engaging UIs.

Dec 23, 2025
4 min read
Discover how high fi wireframes bridge the gap between ideas and code. Learn a practical workflow for creating, testing, and handing off effective UI designs.

Dec 22, 2025
4 min read
Discover mobile app interface design with practical principles, accessibility, and workflows that boost user engagement.

Dec 21, 2025
4 min read
Explore the top 10 UI UX design trends for 2025. Get expert insights and practical React Native tips to build next-gen cross-platform apps that stand out.

Dec 20, 2025
4 min read
Discover how mobile app templates accelerate development from idea to launch. Learn to select, customize, and deploy templates for a faster time to market.

Dec 18, 2025
4 min read
Explore the best react native ui libraries to accelerate mobile development with performance, theming, and accessibility. Expert tips inside.
Dec 16, 2025
4 min read
Master React Native PDF handling. Learn to generate, view, and share PDFs with practical code examples, library comparisons, and performance tips.
Dec 15, 2025
4 min read
A practical guide to choosing the right React Native component library. Learn how to evaluate options, avoid common pitfalls, and build apps faster.

Dec 14, 2025
4 min read
Find the perfect React Native UI library for your project. This guide compares top libraries, selection criteria, and customization strategies.

Dec 13, 2025
4 min read
Learn how to change app name in React Native and Expo. Our guide covers display names, bundle IDs, and store listings for iOS and Android projects.

Dec 12, 2025
4 min read
Discover the best React Native component library for your next project. We compare top libraries on performance, customization, and real-world use cases.

Dec 11, 2025
4 min read
Discover how to choose the right React Native UI kit. This guide covers top kits, selection criteria, and customization to accelerate your app development.

Dec 10, 2025
4 min read
Explore our in-depth guide to find the best React Native UI library. We compare top contenders to help you choose the right fit for your project.
Dec 09, 2025
4 min read
Discover a practical approach to building apps with React Native. This guide covers setup, UI, state management, and testing to help you ship great apps.

Dec 08, 2025
4 min read
android login with facebook: Learn to set up the Facebook SDK, manage tokens, and implement secure authentication across native Android, cross-platform apps.

Dec 07, 2025
4 min read
Master the alert in React Native. Learn to handle platform differences, build custom modals, and apply best practices for a seamless user experience.
Dec 06, 2025
4 min read
keyboardavoidingview react native: Master keyboard handling with KeyboardAvoidingView across iOS, Android, Expo, and TypeScript.
Dec 05, 2025
4 min read
A practical guide to implementing a React Native PDF viewer. Learn to compare libraries, handle native setup, and troubleshoot common issues with real code.

Dec 04, 2025
4 min read
how to validate startup idea: learn proven methods like customer interviews, MVPs, and metrics to confirm market fit.

Dec 03, 2025
4 min read
how to make app like uber: Learn core features, tech stack, development steps, testing, and launch tips.

Dec 02, 2025
4 min read
Build a rock-solid React Native setup. This guide covers Expo vs. Bare workflows, TypeScript, pnpm monorepos, NativeWind, and deployment strategies.

Dec 01, 2025
4 min read
A practical guide to Stripe React Native integration. Learn to set up your server, build payment UIs, handle webhooks, and launch secure mobile payments.

Nov 30, 2025
4 min read
Learn how to master push notifications in React Native. This guide covers setup, best practices, and advanced techniques for engaging your users.

Nov 29, 2025
4 min read
Build powerful location-based apps with our practical guide to react native with google maps. Get setup guides, pro tips, and best practices for iOS & Android.

Nov 28, 2025
4 min read
Explore deep linking react native with a practical guide to configuring URL schemes, universal links, navigation, and testing for Expo and bare apps.

Nov 28, 2025
4 min read
A practical guide to building a scalable React Native design system. Learn to implement tokens, theming, and tools like NativeWind and gluestack-ui.

Nov 26, 2025
4 min read
Learn why react native expo templates speed up your projects with ready-made patterns and practical tips.

Nov 25, 2025
4 min read
Discover how to improve developer productivity with actionable strategies for workflow, tooling, and culture. A practical guide for software engineering teams.

Nov 24, 2025
4 min read
Discover the best cross platform app development tools. Compare top frameworks like Flutter and React Native to build and ship apps faster.

Nov 23, 2025
4 min read
This Expo React Native tutorial provides a hands-on guide to building cross-platform apps. Learn setup, styling with NativeWind, navigation, and deployment.

Nov 22, 2025
4 min read
Build beautiful UIs faster with this guide to Tailwind CSS React Native. Learn setup, styling, and advanced techniques with NativeWind for mobile apps.

Nov 21, 2025
4 min read
Explore our curated list of 7 top-tier React Native app examples. Discover production-ready templates and resources to build your next app faster.

Mar 19, 2025
4 min read
gluestack market offers React Native UI templates to accelerate development. Get customizable, production-ready React Native app templates and Ui kit, some free. Build faster & smarter today!
